Housing and Unemployment: Twin Cities Hardest-Hit Neighborhoods One Year into the Pandemic
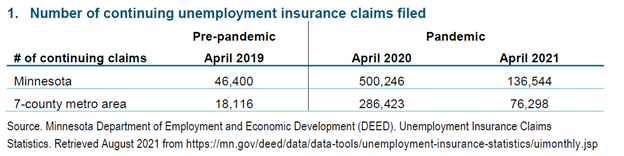
As the COVID-19 pandemic hit Minnesota in March 2020 – marked by state-issued stay-at-home orders to protect public health – our communities felt immediate economic impacts. In April 2020, the number of continuing unemployment insurance claims in Minnesota skyrocketed to 500,246 – a record high. Compared to April of the previous year, this represents a 978% increase in claims filed across the state and a 1,481% increase for the 7-county Twin Cities metro area. Figure 1 illustrates the number of continuing unemployment claims in April for three years, starting with the year prior to the pandemic.
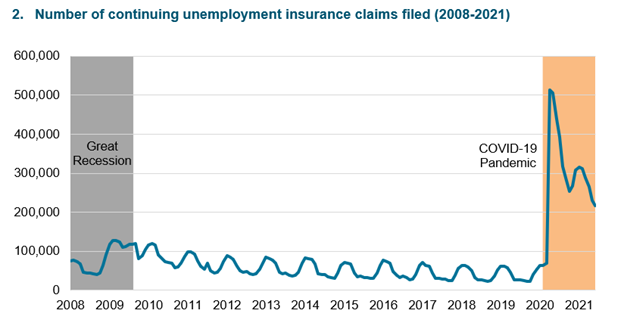
For historical context, this spike in claims far surpassed the one seen in 2009, during the Great Recession (Figure 2).
To learn more about the impact on Minnesotans, Family Housing Fund (FHFund) and Wilder Research (Wilder) partnered, both last year and this year, to analyze unemployment and housing instability data. (See our previous article, titled Housing and Unemployment: Hardest-hit neighborhoods.) We intend to continue monitoring unemployment and housing instability in our region, particularly as new variants of the COVID-19 virus push infection rates higher again (Minnesota Department of Health, 2021).
Unemployment has decreased across the Twin Cities metro, but for most areas it remains higher than before the pandemic.
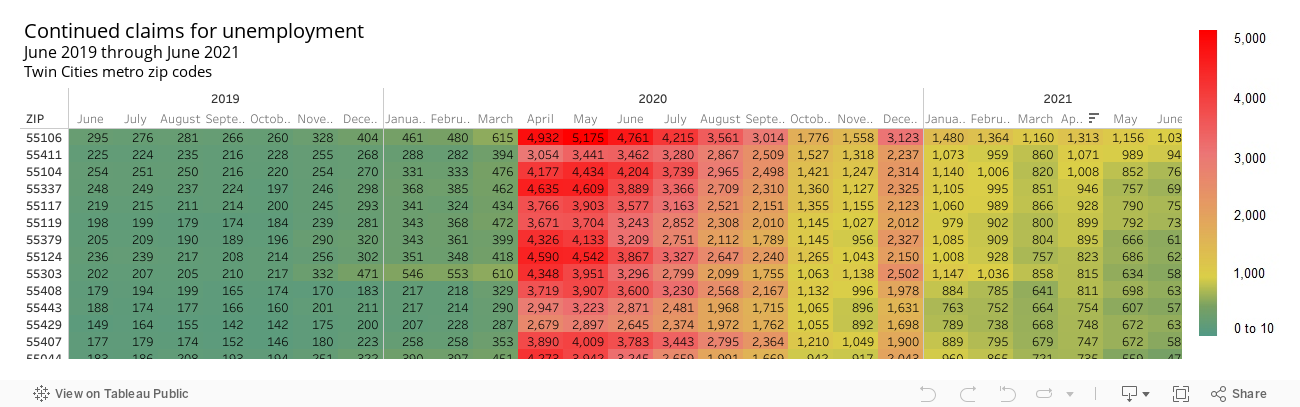
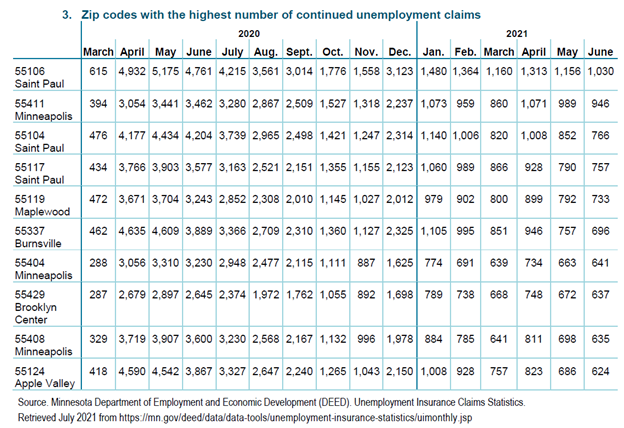
Over the past year, unemployment claims have steadily decreased across the metro region (with the exception of a rise in claims during December 2020). Some zip codes have recovered more quickly than others; however, almost none have returned to their “pre-pandemic” unemployment numbers. For example, Apple Valley (55124) was one of the hardest hit zip codes in April 2020, with 4,590 continued claims that month. As of June 2021, this number had decreased to 624, which is still higher than prior to the pandemic.
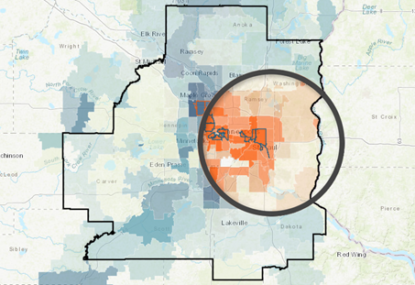
The figure below illustrates the hardest hit zip codes across the past year.
To interact with the data, please click here.
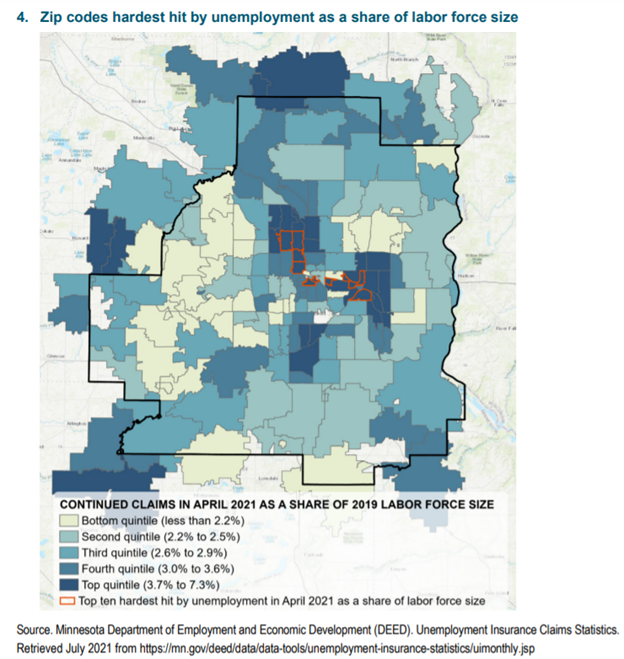
Unemployment continues to be highest in east Saint Paul and its surrounding suburbs, as well as north Minneapolis.
Many of the zip codes that were hardest hit at the beginning of the pandemic continue to have the highest number of claims (relative to the size of the labor market) – particularly north Minneapolis, east Saint Paul, and the suburbs of Burnsville, Apple Valley, Maplewood, and Brooklyn Center (Figure 4).
To view the interactive map, click here.
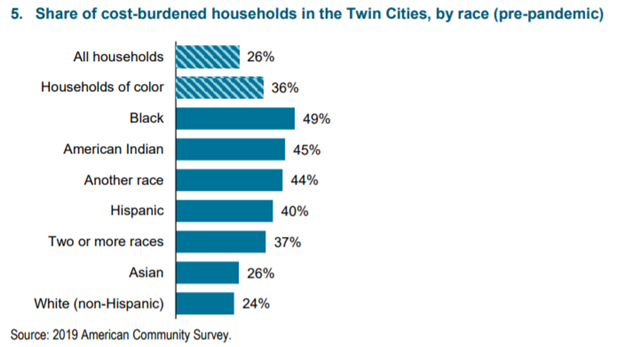
Areas that are hardest hit by continuing unemployment have historically higher housing cost burden and higher proportions of residents who are BIPOC.
In the year preceding the pandemic, roughly one-quarter (26%) of Twin Cities’ households were housing cost-burdened. We do not yet have the data to show the number of cost-burdened households currently; however, we do know that cost-burden is more common in low-income households (87% of households that make less than $20,000 per year are cost-burdened). Due to longstanding disparities in housing and income created by systemic racism, 36% of Black, Indigenous, and People of Color (BIPOC) households experience housing cost burden (Figure 5).
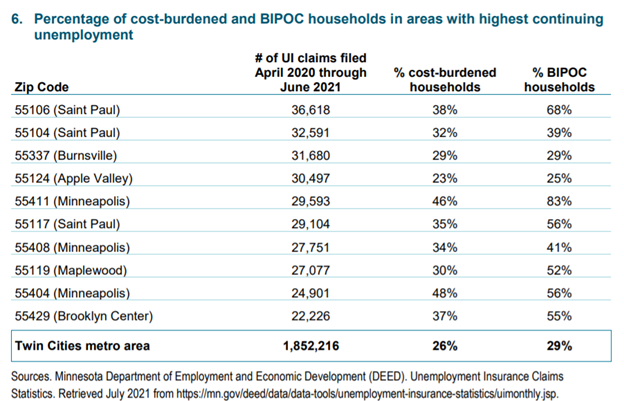
In most of the zip codes hardest hit by unemployment (those with the highest number of continued claims in June 2021), the proportion of cost-burdened households is higher than the average across the Twin Cities (Figure 6). Many of these zip codes also have a higher proportion of BIPOC residents. In Near North Minneapolis (55411), which has among the highest number of continuing claims relative to the pre-pandemic labor force, 83% of residents are BIPOC (Figure 6).
For the average working renter, wages are insufficient to meet rental costs across the Twin Cities.
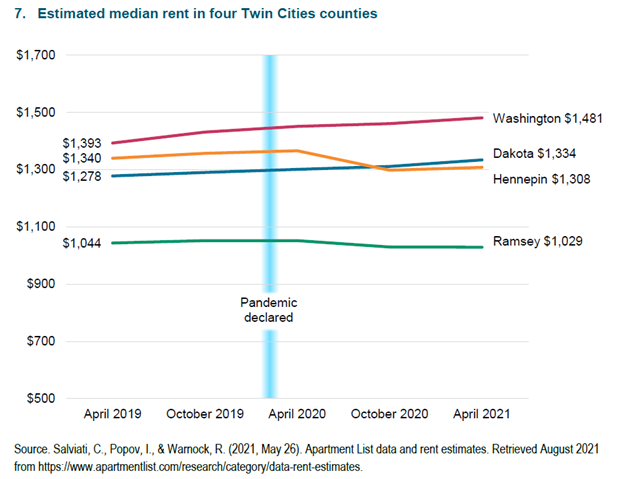
Over the past year, median monthly rent has remained relatively flat (Figure 7); however, more recent data (as of August) are indicating that rental and housing prices are on the rise.
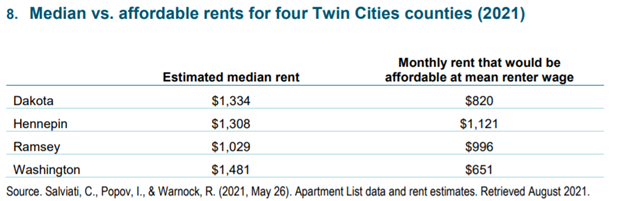
For comparison, Wilder looked at recent data from the National Low Income Housing Coalition, which estimates wages and housing costs in each state, as well as within specific counties (National Low Income Housing Coalition, 2021). Figure 8 illustrates median rental costs in four Twin Cities counties, compared to rent that is considered affordable (based on mean renter wages) in those same geographies. In all four cases, rent is higher than what is affordable.
For example, estimated median rent for Hennepin County in April 2021 was $1,308 per month, whereas rent that is affordable for the average renter with a full-time job was $1,121 (a difference of $187). The gap in Washington County is even larger, with median rent at $1,481 and affordable rent for the average renter with a full-time job at $651. It is important to note that the proportion of residents who rent in Hennepin County is nearly twice the share of residents in Washington County who rent (38% and 19%, respectively).
With uncertainty on the horizon, public and private organizations must continue to provide employment and housing supports in areas with continued unemployment and housing cost-burden.
While unemployment claims have decreased across the region in recent months, claims are still higher than they were prior to the pandemic. In part, we are seeing continued claims because of the uncertainty around so many aspects of daily life due to the pandemic; for example, parents may have a harder time finding work while they are also trying to find child care or manage education and distance learning. Also, fewer retail jobs may be available given the switch to online shopping and social distancing, and some restaurants and businesses have closed permanently. Communities that struggled prior to the pandemic – due, in part, to the inequity and racism built into our state and nation’s housing and employment policies and practices – will continue to struggle without action.
The Minnesota legislature has passed an “eviction moratorium off ramp,” ending the executive order that prohibited most eviction actions and lease terminations throughout the COVID-19 pandemic. As of August 13, 2021, landlords can terminate the lease of renters who are behind in rent and are not eligible for COVID-19 emergency rental assistance. As of September 12, 2021, renters without pending assistance applications can be evicted for nonpayment of rent. (For a detailed timeline and information visit Minnesota Housing’s RentHelpMN website).
Federal emergency rental assistance programs, such as RentHelpMN and the Zero Balance Project, are now beginning to cover missed rent payments for many qualifying households. However, unemployment and housing affordability data show that the need is great and ongoing. As COVID cases rise again in September 2021, Twin Cities community leaders must continue to track unemployment and housing insecurity and work to meet the needs of the households who are hardest hit.
About the Researchers:
Justin Hollis is a research scientist with Minnesota Compass specializing in policy research and program evaluation, data science, and economic analysis.
Anne Li is a research associate supporting a variety of projects related to Minnesota Compass. Her research interests are in housing, immigration, and environmental sustainability.
Stephanie Nelson-Dusek is a research scientist at Wilder Research; her work is focused on housing and homelessness, as well as child and family well-being.
With Support From:
Sarah Berke is a program officer at the Family Housing Fund, focused on strategies to build and preserve affordable housing across the region.
Colleen Ebinger is vice president of the Family Housing Fund, where she oversees programs, communications, and fundraising.
Karyssa Scheck is a grants and special projects manager at Family Housing Fund, where she supports communications and fundraising efforts.
Wilder Research, a division of Amherst H. Wilder Foundation, is a nationally respected nonprofit research and evaluation group. For more than 100 years, Wilder Research has gathered and interpreted facts and trends to help families and communities thrive, get at the core of community concerns, and uncover issues that are overlooked or poorly understood.
Family Housing Fund is a nonprofit intermediary catalyzing change by working together with multiple partners and stakeholders to improve access, affordability, and resiliency across the entire Twin Cities housing sector.
Data Sources for this Article:
Minnesota Department of Health. Situation Update for COVID-19. Retrieved August 2021 from https://www.health.state.mn.us/diseases/coronavirus/situation.html.
Minnesota Department of Employment and Economic Development (DEED). Unemployment Insurance Claims Statistics. Retrieved July and August 2021 from https://mn.gov/deed/data/data-tools/unemployment-insurance-statistics/uimonthly.jsp.
National Equity Atlas. (2021). Rent debt dashboard. Retrieved August 2021 from https://nationalequityatlas.org/rent-debt.
National Low Income Housing Coalition. (2021). Out of reach: The high cost of housing. https://nlihc.org/sites/default/files/oor/2021/Out-of-Reach_2021.pdf.
Salviati, C., Popov, I., & Warnock, R. (2021). Apartment List data and rent estimates. Retrieved August 10, 2021 from https://www.apartmentlist.com/research/category/data-rent-estimates.
U.S. Census Bureau. (2019) 2015-2019 American Community Survey (ACS) 5-year estimates. Public-use microdata samples. www.mncompass.org.